| Adipose_Subcutaneous |
180 |
478 |
678 |
947 |
1147
|
| Adipose_Visceral (Omentum) |
152 |
370 |
526 |
743 |
903
|
| Adrenal Gland |
346 |
829 |
1144 |
1622 |
1999
|
| Artery_Aorta |
293 |
783 |
1161 |
1695 |
2174
|
| Artery_Coronary |
67 |
157 |
212 |
278 |
347
|
| Artery_Tibial |
260 |
686 |
1041 |
1705 |
2370
|
| Bladder |
107 |
267 |
425 |
713 |
1103
|
| Brain_Amygdala |
28 |
71 |
100 |
144 |
218
|
| Brain_Anterior cingulate cortex (BA24) |
41 |
105 |
152 |
232 |
340
|
| Brain_Caudate (basal ganglia) |
97 |
212 |
272 |
365 |
449
|
| Brain_Cerebellar Hemisphere |
1561 |
4324 |
6555 |
10031 |
13112
|
| Brain_Cerebellum |
1237 |
3825 |
6027 |
9635 |
12859
|
| Brain_Cortex |
203 |
424 |
569 |
785 |
1002
|
| Brain_Frontal Cortex (BA9) |
471 |
1020 |
1362 |
1883 |
2463
|
| Brain_Hippocampus |
31 |
79 |
114 |
167 |
231
|
| Brain_Hypothalamus |
159 |
308 |
383 |
485 |
589
|
| Brain_Nucleus accumbens (basal ganglia) |
157 |
363 |
475 |
686 |
869
|
| Brain_Putamen (basal ganglia) |
46 |
108 |
140 |
186 |
238
|
| Brain_Spinal cord (cervical c-1) |
393 |
947 |
1369 |
2000 |
2672
|
| Brain_Substantia nigra |
48 |
119 |
149 |
212 |
290
|
| Breast_Mammary Tissue |
84 |
226 |
314 |
407 |
489
|
| Cells_Cultured fibroblasts |
1097 |
3314 |
5177 |
8152 |
10559
|
| Cells_EBV-transformed lymphocytes |
1658 |
4450 |
6764 |
10402 |
13219
|
| Cervix_Ectocervix |
152 |
440 |
792 |
1659 |
2714
|
| Cervix_Endocervix |
155 |
410 |
670 |
1329 |
2215
|
| Colon_Sigmoid |
116 |
288 |
365 |
516 |
657
|
| Colon_Transverse |
197 |
430 |
576 |
795 |
923
|
| Esophagus_Gastroesophageal Junction |
42 |
99 |
134 |
203 |
253
|
| Esophagus_Mucosa |
463 |
1089 |
1520 |
2094 |
2499
|
| Esophagus_Muscularis |
87 |
205 |
268 |
383 |
474
|
| Fallopian Tube |
300 |
796 |
1226 |
2141 |
3214
|
| Heart_Atrial Appendage |
129 |
319 |
460 |
687 |
887
|
| Heart_Left Ventricle |
129 |
338 |
471 |
653 |
824
|
| Kidney_Cortex |
197 |
496 |
692 |
966 |
1135
|
| Kidney_Medulla |
230 |
741 |
1114 |
1731 |
2423
|
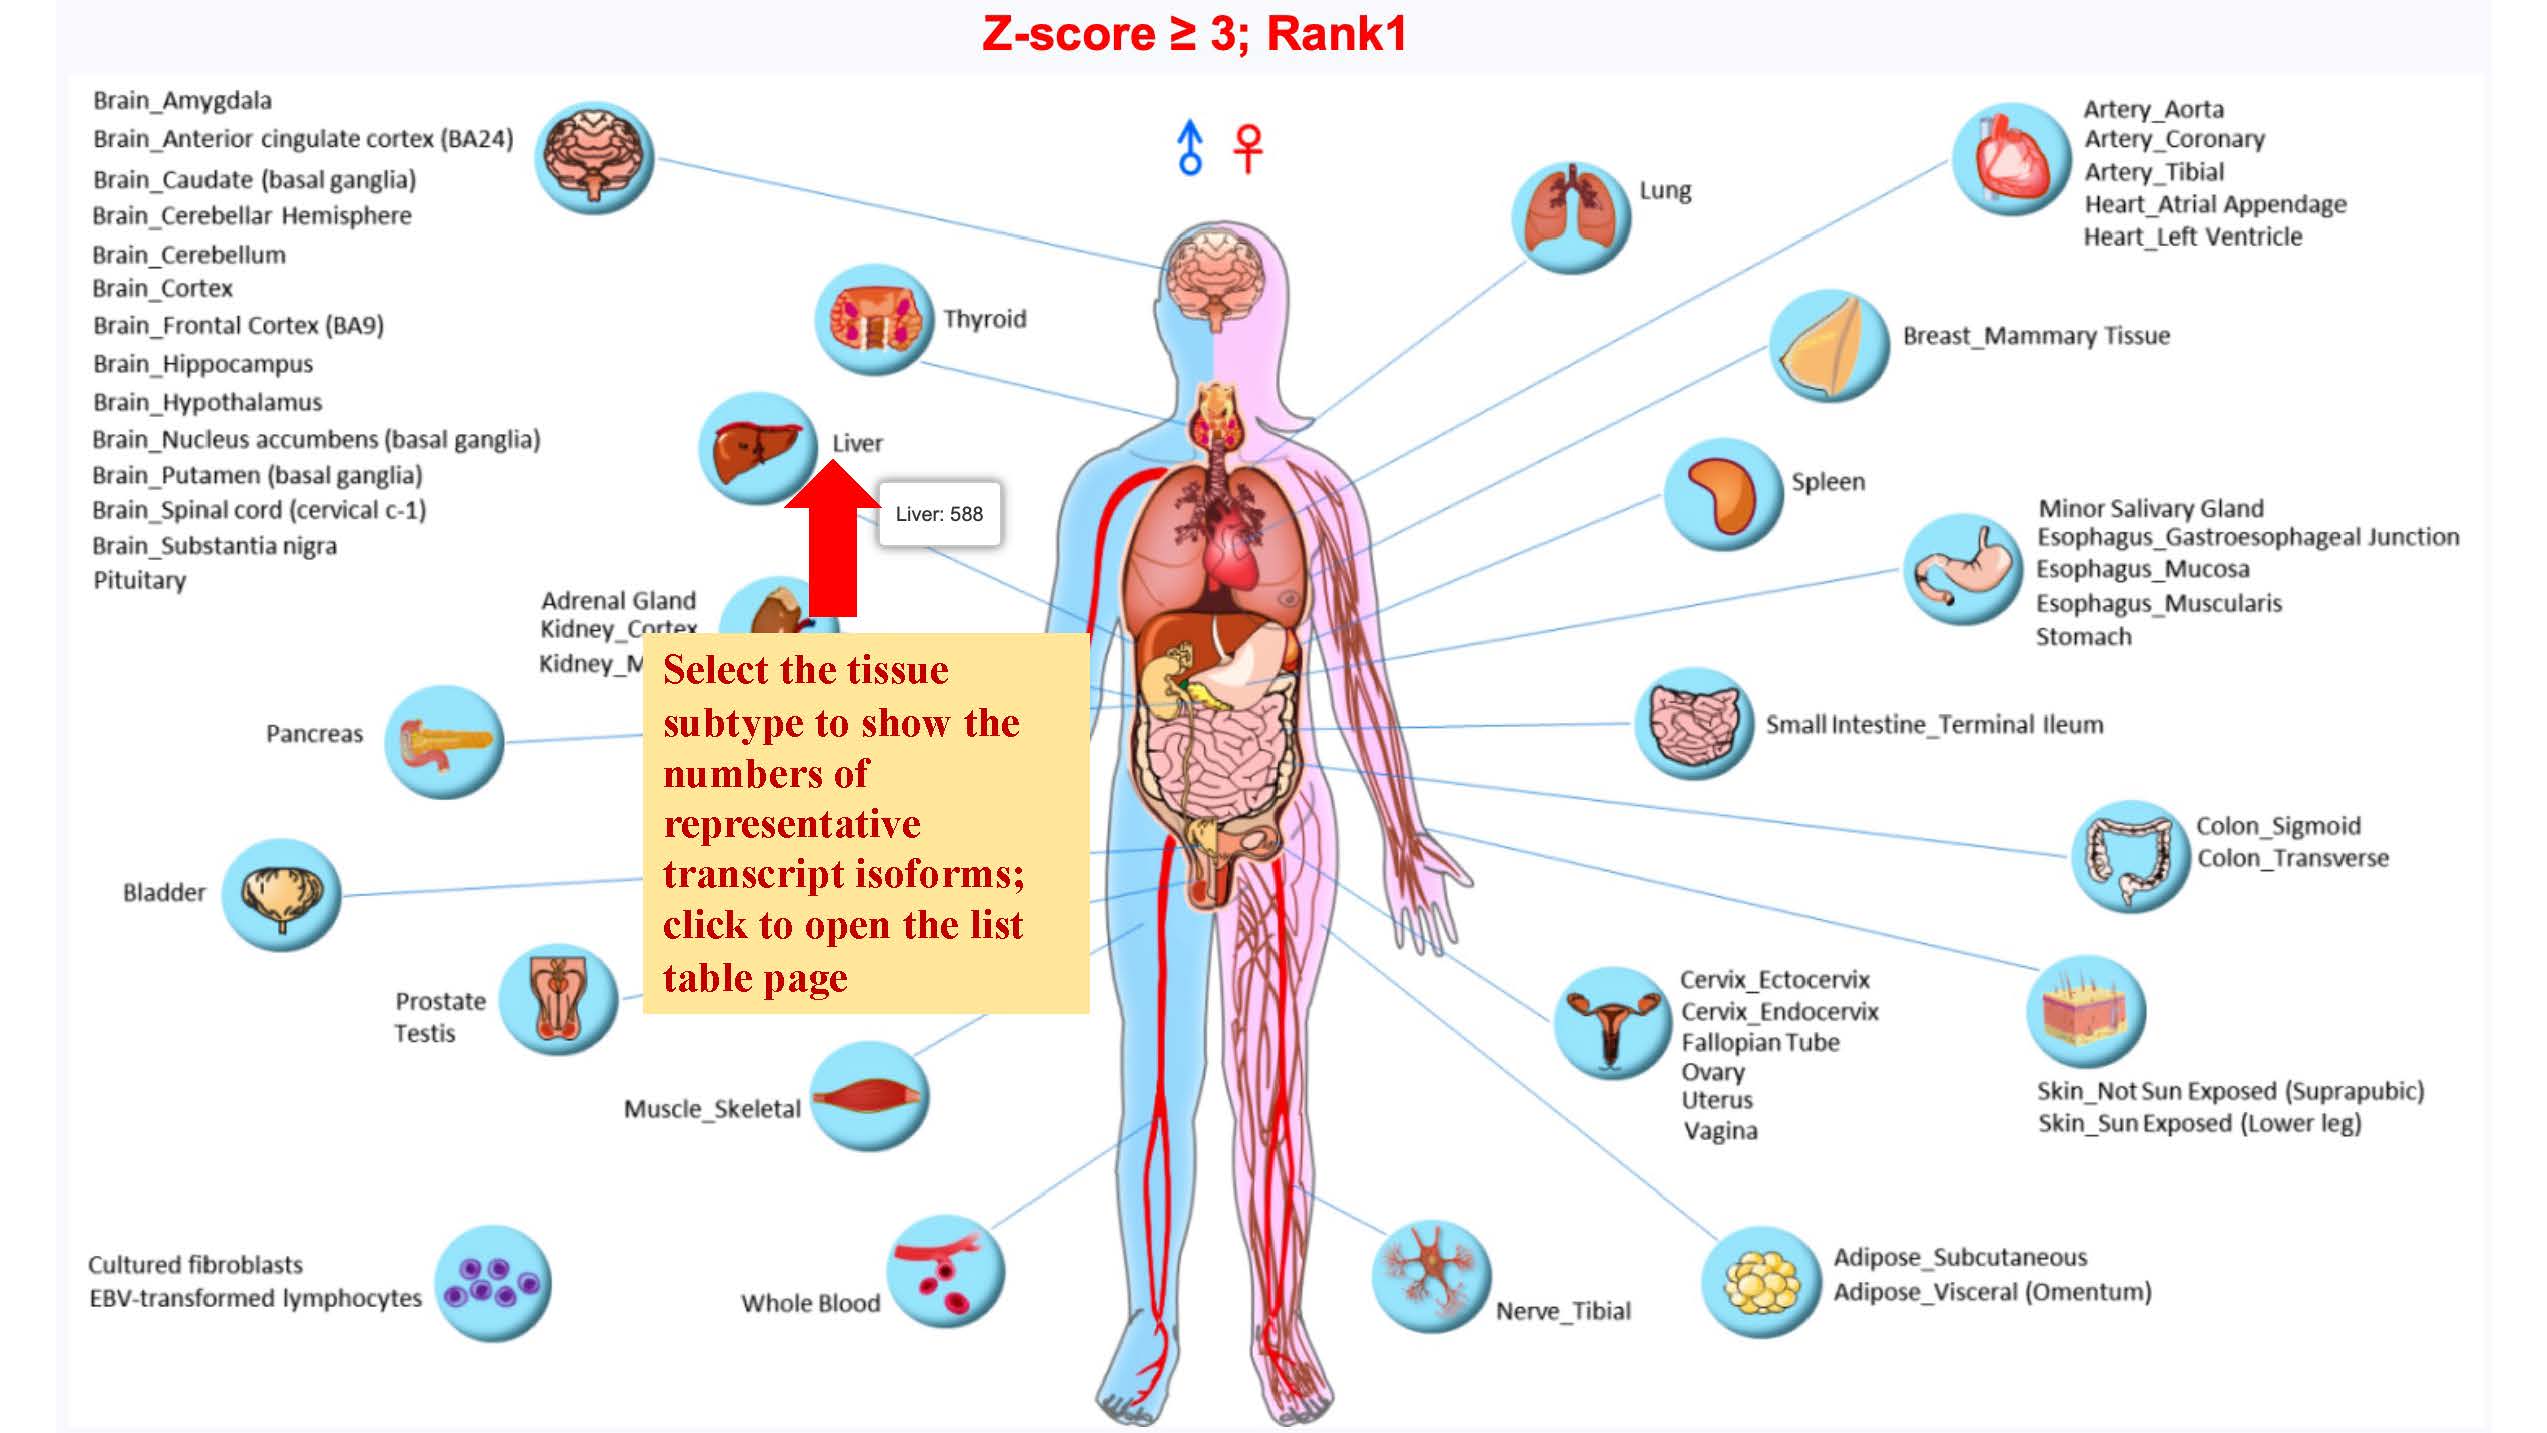
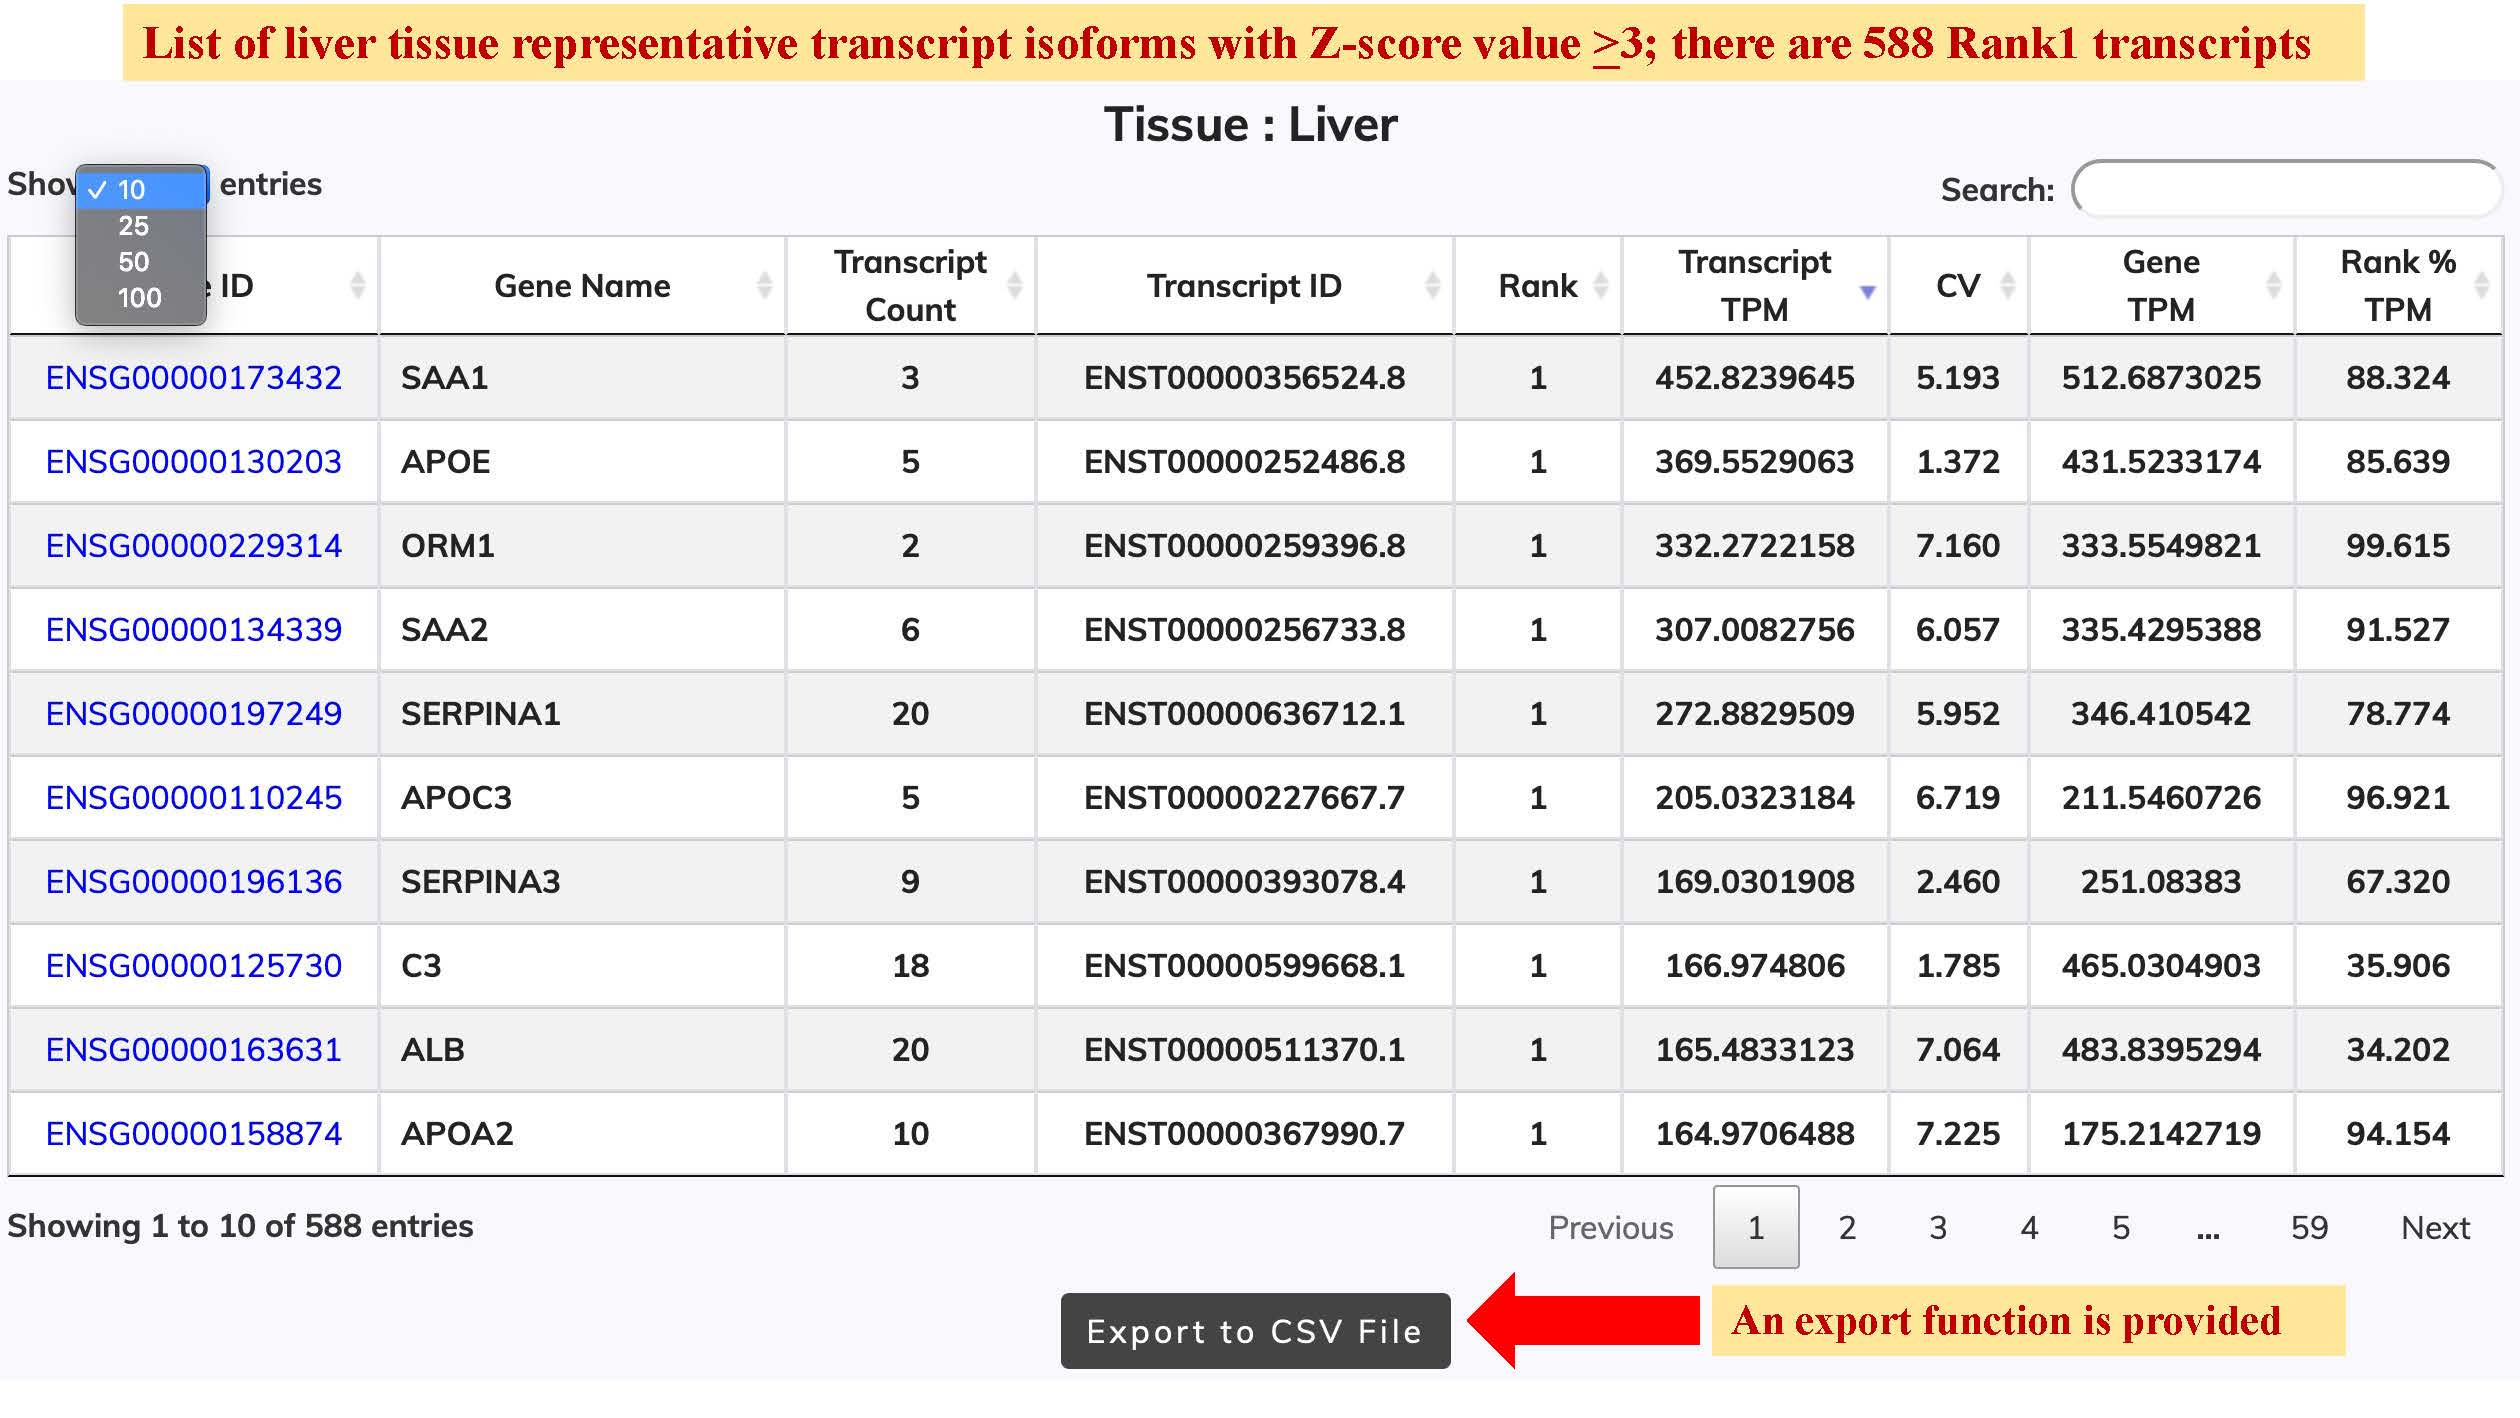
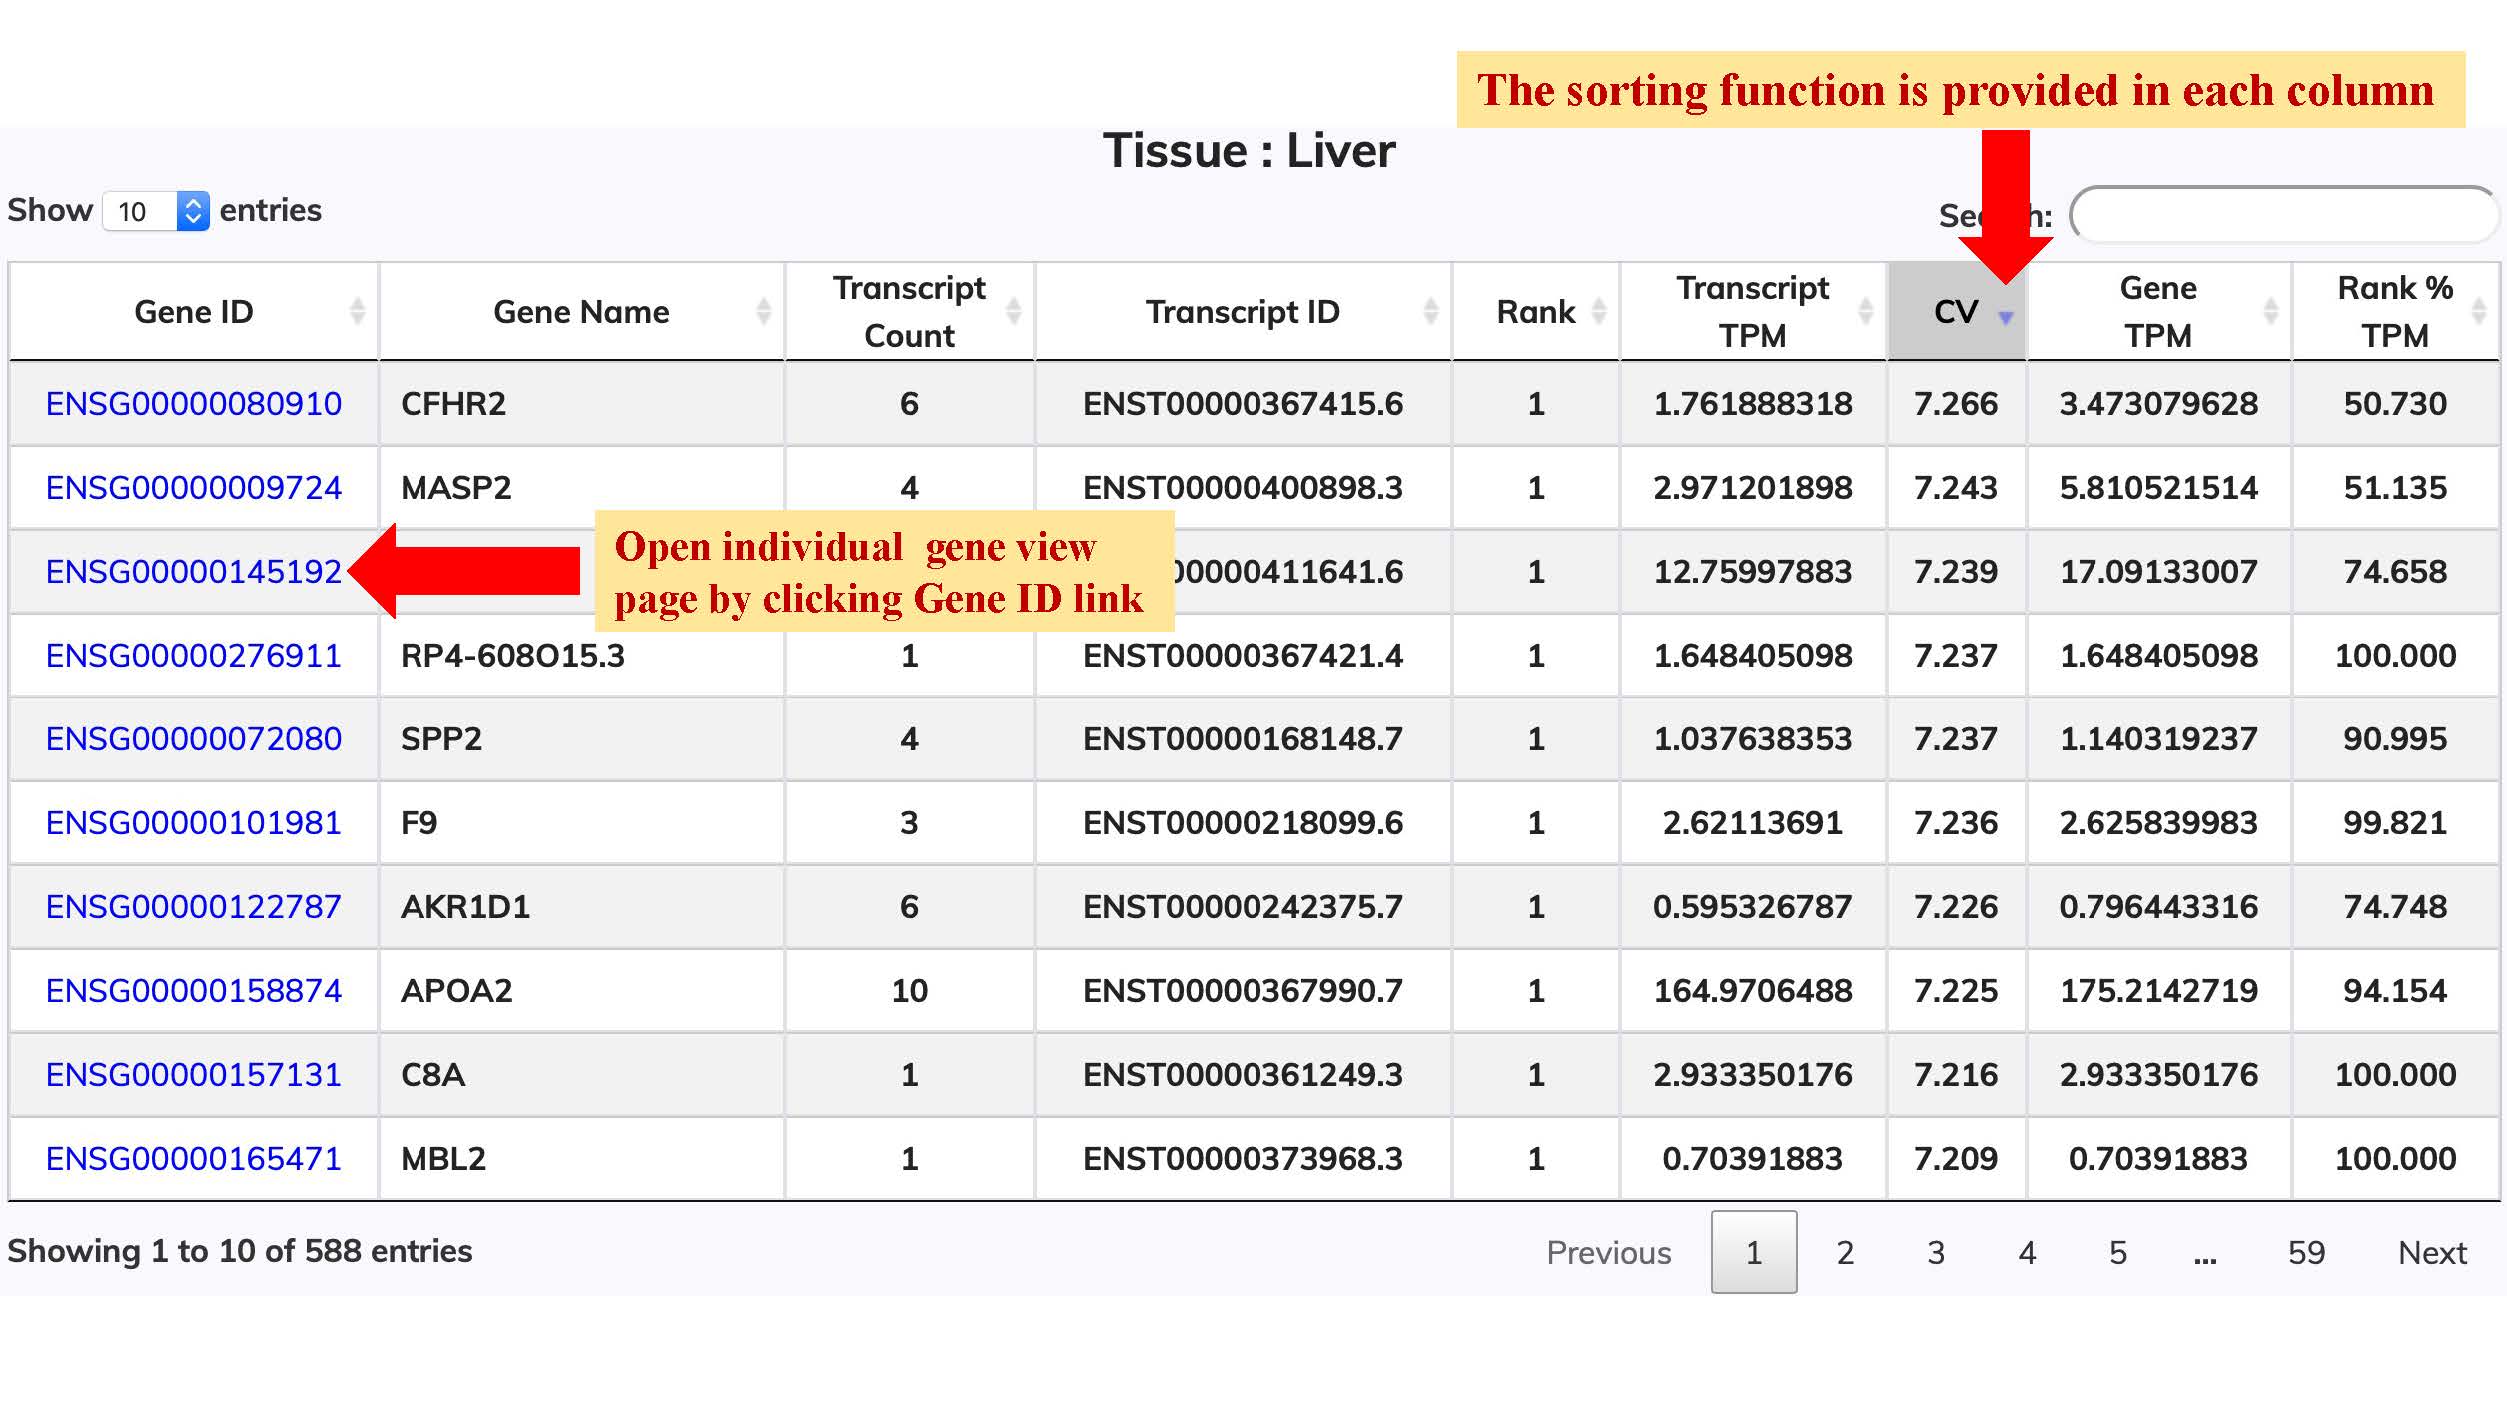
| Liver |
588 |
1535 |
2141 |
2867 |
3333
|
| Lung |
343 |
1054 |
1653 |
2552 |
3115
|
| Minor Salivary Gland |
188 |
472 |
692 |
1008 |
1276
|
| Muscle_Skeletal |
573 |
1416 |
2008 |
2938 |
3832
|
| Nerve_Tibial |
372 |
1054 |
1690 |
2671 |
3375
|
| Ovary |
271 |
778 |
1193 |
1803 |
2308
|
| Pancreas |
141 |
349 |
506 |
671 |
792
|
| Pituitary |
535 |
1544 |
2287 |
3392 |
4178
|
| Prostate |
161 |
445 |
647 |
899 |
1068
|
| Skin_Not Sun Exposed (Suprapubic) |
555 |
1254 |
1759 |
2411 |
2898
|
| Skin_Sun Exposed (Lower leg) |
483 |
1113 |
1576 |
2205 |
2713
|
| Small Intestine_Terminal Ileum |
329 |
818 |
1174 |
1652 |
1973
|
| Spleen |
669 |
1999 |
2971 |
4197 |
4925
|
| Stomach |
97 |
221 |
301 |
422 |
487
|
| Testis |
3529 |
9457 |
14188 |
21692 |
27797
|
| Thyroid |
402 |
1162 |
1719 |
2548 |
3168
|
| Uterus |
128 |
349 |
521 |
775 |
1044
|
| Vagina |
80 |
243 |
378 |
543 |
667
|
| Whole Blood |
527 |
1263 |
1856 |
2747 |
3484
|